

9 Platforms That Show You a Business Snapshot in One Click
Running a business means juggling dozens of metrics, reports, and data sources all at once. The last thing you need is to waste hours clicking through tabs and exporting spreadsheets just to figure out how things are going. That’s where snapshot platforms come in. These tools pull together your most important business information and display it in a single, digestible view. Whether you’re tracking sales, monitoring your team’s progress, or keeping tabs on cash flow, the right platform can save you time and help you make smarter decisions faster. This list covers nine platforms that do exactly that, each bringing something different to the table.
- Legiit

If you run a service-based business or work with freelancers, Legiit gives you a clear view of your projects, orders, and revenue in one simple dashboard. You can see active orders, track deliveries, monitor client communications, and check your earnings without bouncing between different screens. The platform was built specifically for digital services, so everything is organized around the way service providers actually work.
What makes Legiit especially useful is how it handles the full cycle from listing your services to getting paid. You get a snapshot of where each project stands, which clients need attention, and how your income is trending. For anyone managing multiple service orders or coordinating with a team of freelancers, this kind of visibility keeps things running smoothly without the usual chaos.
- Baremetrics
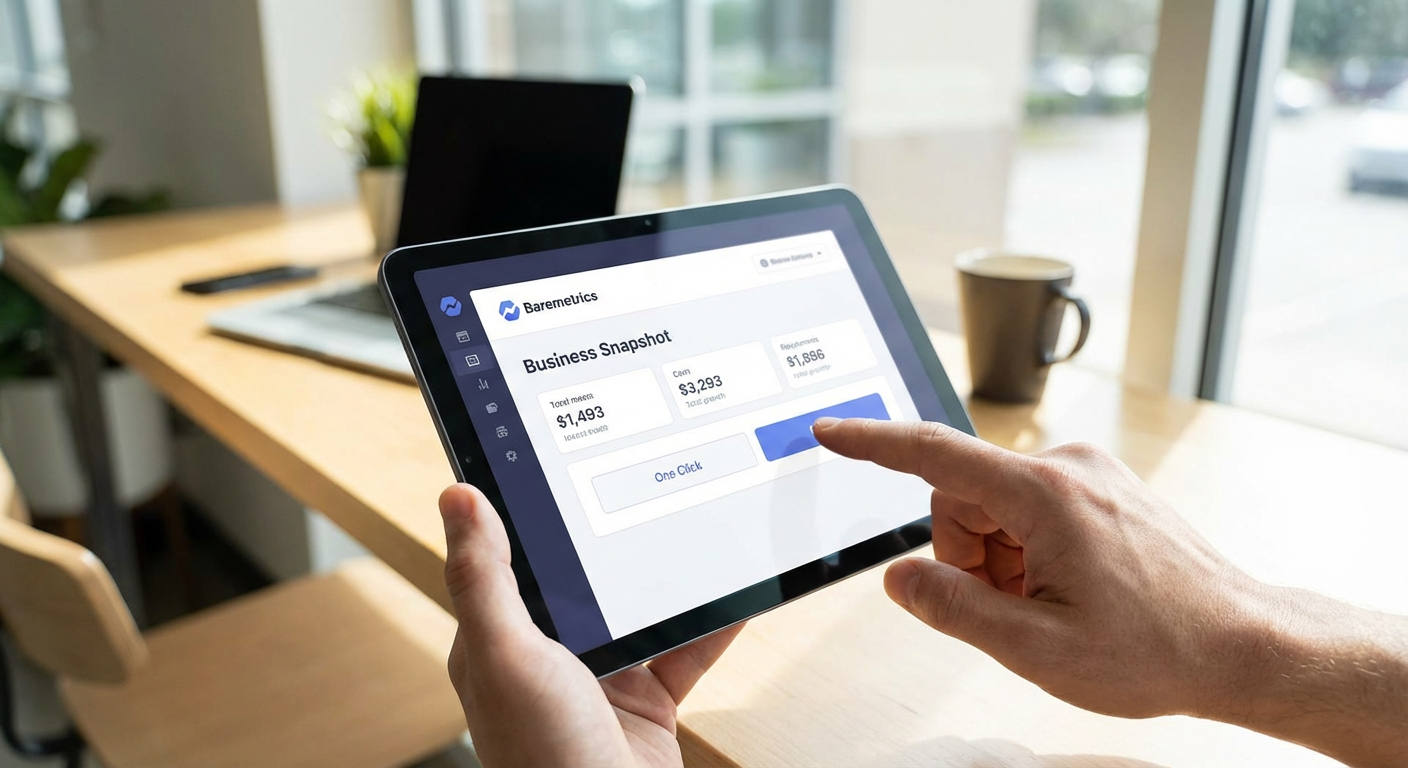
Baremetrics is built for subscription businesses that need to understand their recurring revenue at a glance. When you connect your payment processor, the platform automatically calculates metrics like monthly recurring revenue, churn rate, customer lifetime value, and growth trends. You get a visual dashboard that updates in real time, so you always know exactly where your subscription business stands.
The snapshot view makes it easy to spot problems before they become serious. If your churn rate starts climbing or your average revenue per user drops, you’ll see it immediately. Baremetrics also breaks down your revenue by plan, customer segment, and time period, which helps you understand what’s working and what needs attention. For anyone running a SaaS product or membership site, this platform turns messy payment data into clear, actionable insights.
- Geckoboard
Geckoboard specializes in creating live dashboards that display key metrics from all your business tools in one place. You can connect data sources like Google Analytics, Salesforce, Zendesk, and dozens of others, then arrange them into a custom dashboard that shows exactly what you care about. The interface is clean and visual, with charts and numbers that update automatically throughout the day.
What sets Geckoboard apart is how it’s designed for team visibility. Many companies display these dashboards on office monitors so everyone can see how the business is performing in real time. You can create different dashboards for different purposes, like one for sales metrics, another for customer support, and another for marketing campaigns. This makes it easy to keep everyone aligned without scheduling extra meetings or sending status reports.
- Klipfolio
Klipfolio is a business intelligence platform that pulls data from multiple sources and turns it into visual dashboards you can customize to your exact needs. Unlike some platforms that force you into predefined templates, Klipfolio lets you build your dashboards from scratch using their drag-and-drop editor. You can connect spreadsheets, databases, web services, and marketing tools, then display the metrics that matter most to your business.
The platform shines when you need to combine data from sources that don’t normally talk to each other. For example, you might pull sales data from your CRM, website traffic from Google Analytics, and inventory numbers from your internal database, all displayed side by side. Klipfolio gives you formulas and functions to manipulate your data however you need, which means you can create highly specific metrics that reflect your actual business model. It takes a bit more setup than plug-and-play options, but the flexibility pays off if you have unique reporting needs.
- Databox
Databox brings together data from your marketing, sales, and analytics tools into a single dashboard that updates continuously. The platform connects with over 70 different services, including Google Analytics, HubSpot, Facebook Ads, Stripe, and Shopify. Once connected, you can build custom dashboards or use their pre-made templates to get started quickly.
One particularly helpful feature is the mobile app, which lets you check your business metrics from anywhere without logging into a computer. You can set up alerts that notify you when certain metrics hit specific thresholds, like when daily revenue exceeds a target or when website traffic drops below normal. Databox also includes goal tracking, so you can see at a glance whether you’re on track to hit your monthly or quarterly targets. The snapshot view keeps everyone on your team informed without requiring them to dig through individual tools.
- Cyfe
Cyfe is an all-in-one dashboard platform that connects to popular business tools and presents your data in a unified view. You can monitor social media metrics, website analytics, sales numbers, email marketing performance, and financial data all from one screen. The platform offers pre-built widgets for common services, which makes setup straightforward even if you’re not particularly technical.
Cyfe stands out for its affordability and simplicity. You don’t need to be a data analyst to create useful dashboards. Just pick the widgets you want, arrange them on your screen, and you’re done. The platform also supports custom data sources, so if you have internal systems or less common tools, you can still pull that information into your snapshot view. For small businesses or solo entrepreneurs who need a quick overview without a steep learning curve, Cyfe delivers exactly what you need.
- Grow
Grow is a business intelligence platform designed specifically for mid-sized companies that need more than basic dashboards but don’t want the complexity of enterprise software. The platform connects to hundreds of data sources and uses automated data pipelines to keep your dashboards current. You can create different views for different departments, each showing the metrics that team cares about most.
What makes Grow particularly useful is its focus on collaboration. Team members can leave comments on specific metrics, tag colleagues with questions, and create shared views that everyone can access. The platform also includes data transformation tools, so you can clean up messy data, combine fields, and create calculated metrics without needing SQL knowledge. Grow gives you both the snapshot view for quick checks and the ability to dig deeper when you need to understand what’s driving the numbers.
- Sisense
Sisense is a powerful analytics platform that can handle large datasets and complex data relationships while still presenting everything in clear, visual dashboards. The platform is built for companies that need to analyze data from multiple sources, including databases, cloud applications, and data warehouses. Despite its technical capabilities, Sisense creates dashboards that non-technical users can understand and interact with easily.
The snapshot view in Sisense can include drill-down capabilities, which means you can start with a high-level overview and click into specific areas for more detail. For example, you might see total revenue at a glance, then click to see revenue by product, then click again to see revenue by product and region. This layered approach gives you both the quick snapshot and the ability to investigate when something catches your attention. Sisense works well for data-driven companies that need serious analytical power without sacrificing usability.
- DashThis
DashThis focuses specifically on marketing reporting, making it ideal for agencies and marketing teams that need to show clients or executives what’s happening across multiple channels. The platform connects to all the major marketing tools, including Google Ads, Facebook, Instagram, LinkedIn, Google Analytics, and email marketing platforms. You can create branded reports that update automatically, so clients always have access to current data.
The snapshot feature shows key performance indicators for all your campaigns in one view, with visual charts that make trends easy to spot. You can set up separate dashboards for different clients or different campaigns, each highlighting the metrics that matter for that specific project. DashThis also includes automated reporting, which means you can schedule reports to be sent via email on a regular basis. This saves hours of manual work and ensures everyone stays informed without you having to constantly update spreadsheets or create presentation slides.
Having instant access to your most important business metrics changes how you make decisions and manage your day. Instead of scrambling to pull reports when questions come up, you can glance at a dashboard and know exactly where things stand. The platforms on this list each offer different strengths, from subscription analytics to marketing reporting to comprehensive business intelligence. Pick the one that matches your business model and the metrics you check most often. Once you have that snapshot view in place, you’ll wonder how you ever managed without it.
