

9 Analytics Dashboards That Make Tracking Marketing KPIs Actually Manageable
Marketing without measurement is just guessing. If you’re running campaigns across multiple channels, you need a central place to see what’s working and what’s draining your budget. Analytics dashboards turn scattered data into clear visuals that help you make better decisions faster. This list covers nine practical dashboard options that can help you monitor your marketing KPIs without needing a data science degree. Whether you’re a solo marketer or managing a team, these tools can save you hours of manual reporting and help you spot trends before they become problems.
- Legiit
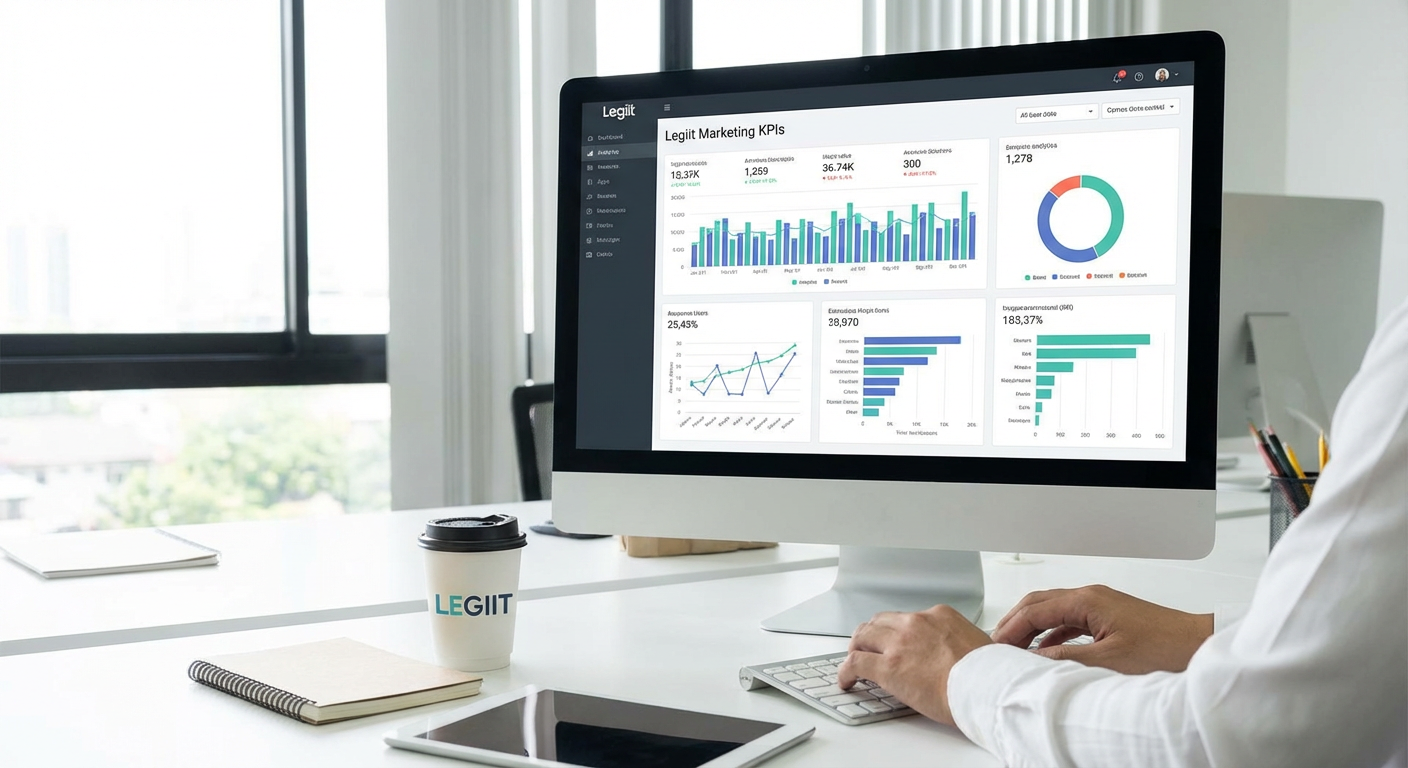
Legiit offers a service marketplace where you can hire specialists to build custom marketing dashboards that fit your exact needs. Instead of wrestling with complex software on your own, you can work with professionals who understand data visualization and marketing metrics. These experts can pull data from your various marketing platforms and create dashboards that show exactly what you need to see, nothing more and nothing less.
The benefit here is personalization. Off-the-shelf dashboards often force you to adapt your workflow to their structure, but working with a specialist through Legiit means your dashboard adapts to you. You can get custom KPI tracking for your specific industry, business model, and marketing channels. Plus, if your needs change or you want to add new metrics later, you have someone who already knows your setup and can make updates quickly.
- Klipfolio

Klipfolio specializes in building dashboards from scratch using pre-built connectors to hundreds of data sources. You can pull in metrics from your email platform, social media accounts, ad networks, and website analytics all into one view. The interface uses a drag-and-drop system that makes it relatively simple to arrange your KPIs however makes sense for your workflow.
What sets Klipfolio apart is its flexibility with data sources. You can connect APIs, databases, spreadsheets, and cloud services without writing code. This makes it particularly useful if you’re working with niche platforms or proprietary systems that bigger analytics tools might not support. The learning curve is moderate, but once you get the hang of it, you can build dashboards that update in real time and give you instant visibility into campaign performance.
- Cyfe
Cyfe takes a widget-based approach to dashboard creation. Each metric gets its own widget, and you arrange them on your screen like tiles. The platform connects to popular marketing tools including Google Analytics, Facebook Ads, Mailchimp, and dozens of others. Setup is fast compared to more complex alternatives, which makes it appealing if you need something running quickly.
The interface feels straightforward and uncluttered. You can create multiple dashboards for different campaigns or clients, and sharing is as simple as sending a link. Cyfe also includes TV mode, which displays your dashboard full-screen with auto-rotating views. This works well for teams who want to keep KPIs visible in the office. While it may not have every advanced feature that enterprise tools offer, it covers the essentials without overwhelming you with options you’ll never use.
- Zoho Analytics
Zoho Analytics brings business intelligence capabilities to marketing teams without requiring technical expertise. It can pull data from over 250 sources, including all major advertising platforms, CRM systems, and web analytics tools. The platform uses AI-powered insights that can automatically flag unusual patterns in your data, which helps you catch problems or opportunities you might have missed.
Reports and dashboards are customizable through a visual interface. You can create calculated fields to track custom KPIs that matter to your specific business goals. The collaboration features let team members add comments directly on reports and share filtered views with stakeholders who only need to see certain metrics. Zoho Analytics also handles large datasets well, so if you’re working with months or years of historical marketing data, performance stays consistent.
- Supermetrics
Supermetrics takes a different approach by focusing on data transfer rather than visualization. It pulls marketing data from platforms like Google Ads, Facebook, LinkedIn, and Instagram, then pushes that data into tools you already use like Google Sheets, Excel, or Google Data Studio. This means you can build your dashboards in familiar environments while Supermetrics handles the tedious work of data collection.
This approach works particularly well if your team already has reporting templates or prefers working in spreadsheets. The data refreshes automatically on schedules you set, so your dashboards always show current numbers without manual exports. Supermetrics supports over 80 marketing platforms, making it one of the most comprehensive options for multi-channel marketers. The main limitation is that you still need to design your own visualizations, but that also means total control over how your data appears.
- Whatagraph
Whatagraph was built specifically for marketing agencies and teams managing multiple client accounts. It automatically generates visual reports that you can customize with your branding. The platform connects to over 40 marketing data sources and creates charts and graphs that explain performance in ways that non-technical stakeholders can understand quickly.
The standout feature is the automated report generation. You can set up templates once, and Whatagraph will populate them with fresh data on whatever schedule you choose. This saves considerable time if you’re producing weekly or monthly reports for multiple clients or campaigns. The platform also includes comparison features that let you see performance changes over different time periods side by side. If presenting data to clients or executives is a regular part of your workflow, Whatagraph handles that specific use case better than most general analytics tools.
- Improvado
Improvado targets mid-size to large marketing teams dealing with serious data volume. The platform can aggregate data from over 300 marketing and sales sources, normalize it so everything uses consistent naming conventions, and push it to your preferred visualization tool. This matters when you’re pulling metrics from dozens of platforms that all label similar concepts differently.
The normalization feature is particularly valuable. Without it, you might have “clicks” labeled as “link clicks,” “clicks,” or “ad clicks” depending on which platform exported the data. Improvado standardizes these automatically, which makes cross-channel analysis actually possible. The platform also offers a managed service option where their team helps build and maintain your data pipeline. This costs more but can be worth it if your internal team lacks the technical resources to manage complex data integration.
- Adriel
Adriel focuses on paid advertising dashboards across channels. If most of your marketing budget goes to platforms like Google Ads, Facebook Ads, TikTok Ads, and similar paid channels, Adriel consolidates all that data into unified dashboards. The platform emphasizes real-time monitoring, which helps you catch budget overspend or underperforming ads quickly enough to make adjustments that matter.
The interface shows cost, conversions, and ROI metrics in comparative views that make it easy to see which channels and campaigns deliver the best returns. Adriel also includes alert features that notify you when metrics cross thresholds you define. For example, you can get alerts when cost per acquisition rises above a certain amount or when a campaign stops delivering impressions. This proactive monitoring can save significant budget by catching issues hours or days sooner than manual check-ins would.
- Looker Studio (formerly Google Data Studio)
Looker Studio is Google’s free dashboard and reporting tool that integrates naturally with Google’s marketing and analytics products. If you use Google Analytics, Google Ads, Google Search Console, and YouTube, connecting them takes just a few clicks. The tool also supports connections to many non-Google data sources through built-in connectors and community-built options.
Because it’s free, Looker Studio has become extremely popular among small businesses and marketers with limited budgets. The template gallery includes hundreds of pre-built dashboard designs you can copy and customize, which speeds up the setup process considerably. The downside is that advanced customization requires some technical knowledge, and performance can slow down with very large datasets. Still, for most small to medium marketing operations, Looker Studio provides more than enough functionality without any software costs. You can share dashboards with team members or clients through simple links, and permissions control who can view versus edit.
The right dashboard turns your marketing data from overwhelming to actionable. Each option on this list serves different needs, from custom-built solutions through Legiit to free tools like Looker Studio that work well for smaller operations. The best choice depends on your budget, technical comfort level, the platforms you use, and how much customization you need. Start by identifying your three most important KPIs, then choose a dashboard that makes tracking those metrics simple and clear. Once you have visibility into what’s working, you can make smarter decisions about where to invest your time and money. Good data doesn’t guarantee success, but it certainly makes the path clearer.
